- rule builder
- the dwelling place
- miscellaneous
show me

a design exercise:
creating a ui for a complex rules engine
As a design exercise a colleague challenged me to create a graphical interface for a rather complex rule builder. The idea was to take something that was very technically complex and make it easier to understand and use than previous methods.

the starting point
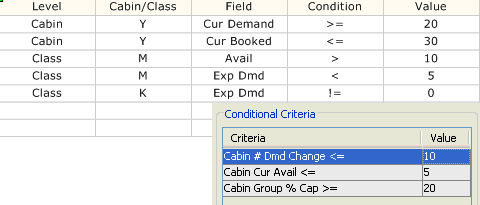
I was given these two pieces of data: the 'conditional criteria' that represented their current system, and the table that represented how they would build it in excel.

the formula
To get started, I boiled down what I was trying to accomplish to a formula. The most complex part was the ability to nest and group the conditional statements indefinitely.

the result
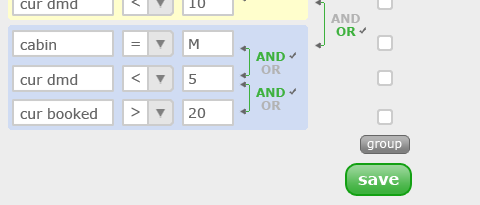
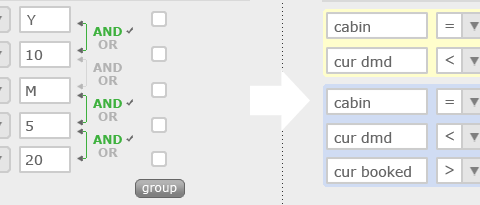
A user enters the criteria, selects the condition from the drop-down and fills in the value they wish to compare. That's fairly straight forward. The interesting parts are the ability to not only select the relationship between each pair of lines (and/or), but the ability to group them by checking off members to add to a group, and hitting group. The second figure represents the result of one grouping, or how you would represent the formula.

